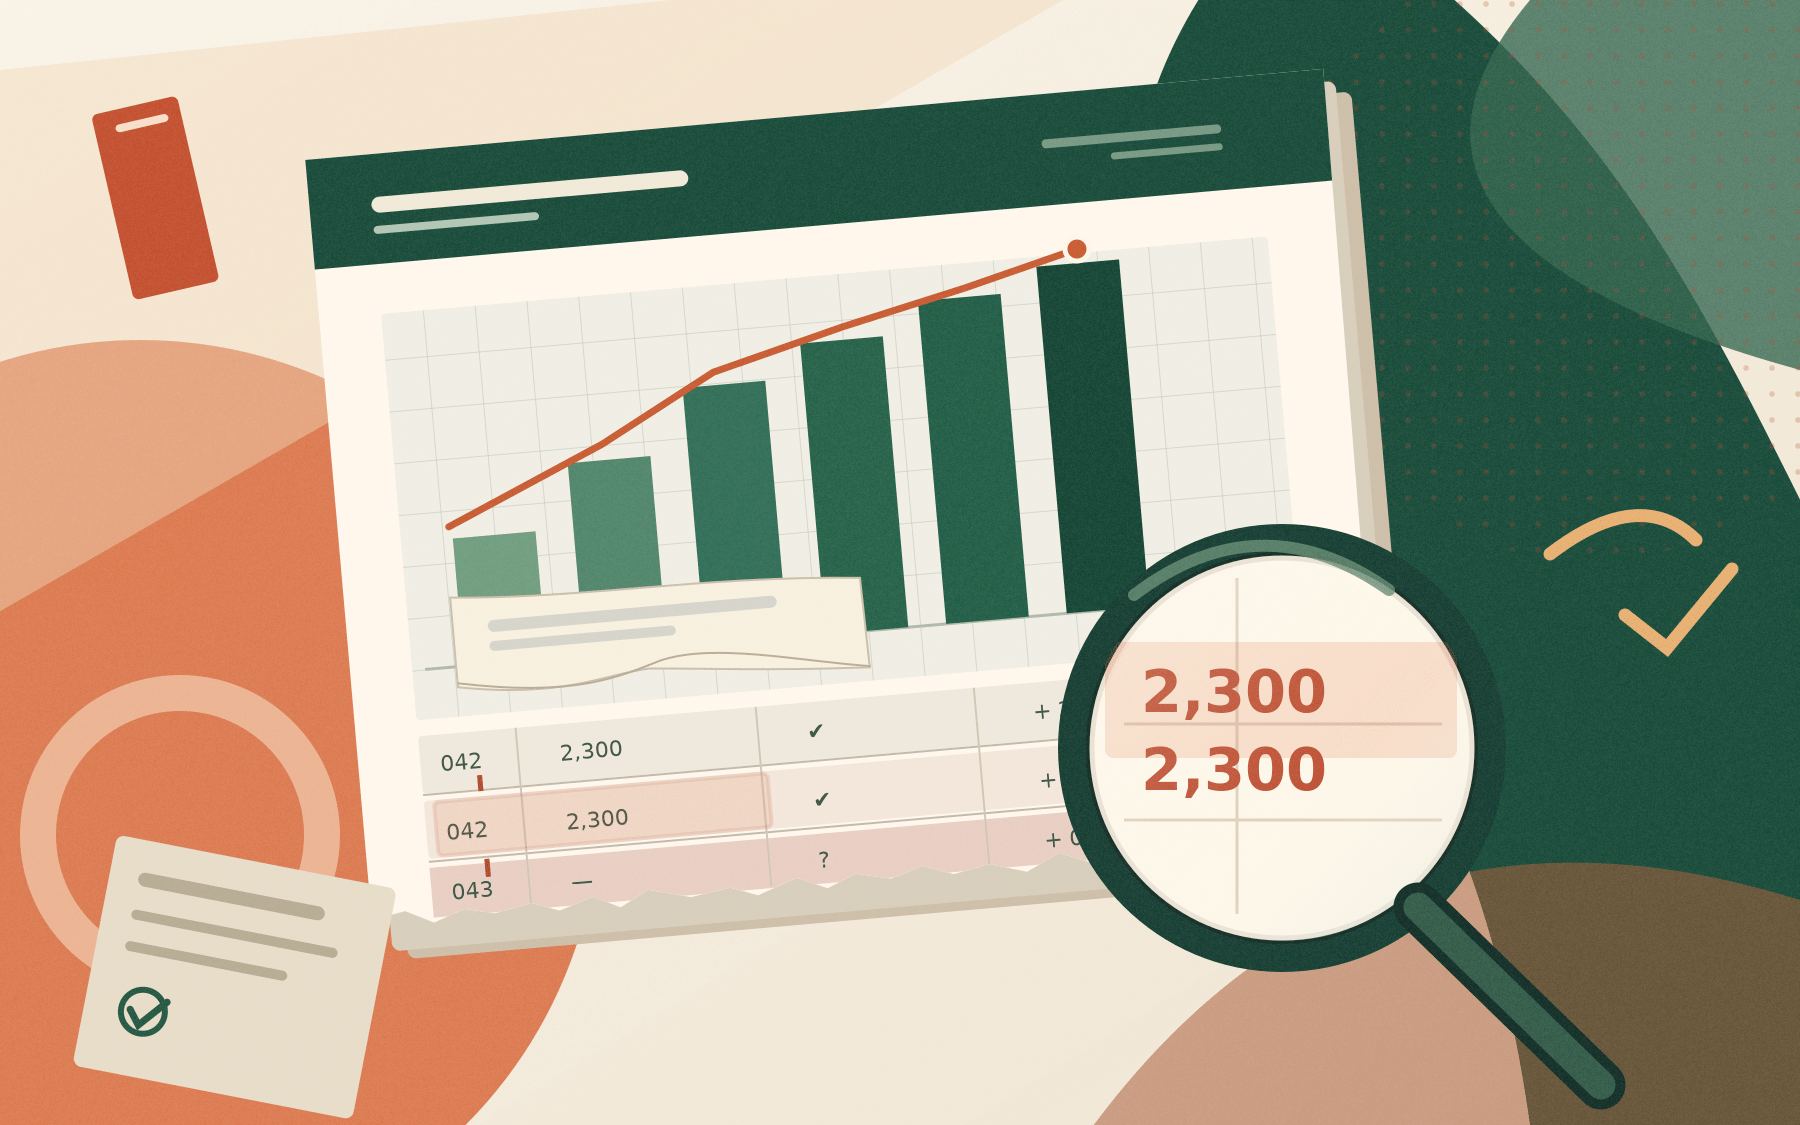
You ask an AI assistant to summarise a sales sheet. It returns a neat table, a confident explanation and a chart ready for your meeting. The result looks finished. But one cancelled order is still counted as revenue, a duplicate invoice has been added twice and the date filter covers the wrong month.
The danger is not an obviously broken spreadsheet. It is a believable answer built on the wrong rows.
Both Microsoft and Google now document AI features that help create formulas, analyse tables and generate insights in spreadsheets. Microsoft explicitly advises people to review and verify AI-created work. The practical habit to build is a quick audit of the numbers before anyone relies on them.
Start with the question, not the chart
Before accepting any AI-generated summary, write the exact decision you are trying to support. For example, instead of asking for total sales, ask for completed orders placed in September, excluding cancelled and duplicate invoices, using the amount after discounts and before tax.
That sentence gives you a way to check the answer. Without it, a polished dashboard can hide a disagreement about what counts.
The six checks that catch most everyday spreadsheet mistakes
The six-point spreadsheet audit
- Scope confirm the sheet, columns and date period the AI used.
- Status confirm cancelled, returned, draft or pending records are treated correctly.
- Duplicates look for repeated order IDs or the same transaction imported twice.
- Missing values count blank prices, dates, IDs and unexpected text in number columns.
- Units and definitions check whether values are rupees, dollars, quantities, percentages, gross or net amounts.
- Arithmetic manually recompute a small sample and one important total without relying on the AI explanation.
See how a small example changes the answer
Imagine a four-row order sheet. Order A is completed for ₹200. Order B is cancelled for ₹150. Order C is completed for ₹50. Order A appears again because the file was imported twice.
A naive total of all four rows is ₹600. The total of unique completed orders is only ₹250. If a summary reports four orders and ₹600 in sales, its formatting may be perfect but its business meaning is wrong.
The same problem shows up in recruitment trackers where one candidate appears twice, attendance sheets that mix present and late, or expense reports where refunded payments remain in the totals.
A trustworthy AI spreadsheet result is one you can trace back to the exact rows, filters and calculations.
Try this now with a copy of a small sheet
Make a duplicate of a non-sensitive spreadsheet or create a fictional table with ten rows. Use your approved AI tool to request a summary, but do not let it overwrite the original. If your spreadsheet AI is unavailable, copy only fictional sample rows into an approved chat tool.
Copy-paste prompt for a spreadsheet audit
Act as a careful spreadsheet reviewer. Do not change any source cells.
My business question is [state the exact question]. The relevant columns are [list columns]. The time period is [date range]. Valid records are [define status].
Before calculating anything, identify missing fields, duplicates, inconsistent dates, unusual units and ambiguous definitions. State the rows you would exclude and why. Then show the formula or calculation logic for each result. Provide a small sample I can recompute manually. If a column or rule is unclear, ask rather than guessing. Do not invent missing data.
Verify before sharing the selected date range, excluded rows, one independently calculated total and the meaning of each metric.
Check the calculation, not just the explanation
When an AI assistant proposes a formula, ask what each referenced cell represents. If a price is in B2 and quantity in C2, a line total might be calculated as =B2*C2. Check that the formula is copied only to the intended rows and that prices are numeric. A correct-looking formula applied to the wrong column still produces the wrong answer.
In Google Sheets, Gemini can help create formulas, analyse data and show analysis steps for supported users. In Excel, Copilot can explain existing formulas, suggest new ones and surface trends or outliers. Availability depends on the relevant subscription and organisational settings. These features make exploration easier, not independent validation unnecessary.
What to do before a client report or team meeting
A two-minute sign-off
- Keep the original data unchanged and save the AI output separately.
- Write down the filter, date range and excluded statuses in one sentence.
- Check the three largest values and one randomly selected row.
- Recalculate the headline number independently.
- Add a short note explaining what the AI helped with and what a person checked.
For payroll, financial reporting, hiring or other consequential decisions, use the organisation’s established review and approval process rather than treating this short audit as sufficient.
AI can make a spreadsheet faster to explore. The skill worth keeping is knowing which rows deserve to be counted in the first place.
Sources
Microsoft Support – Get data insights with Copilot in Excel
Google Docs Editors Help – Collaborate with Gemini in Google Sheets